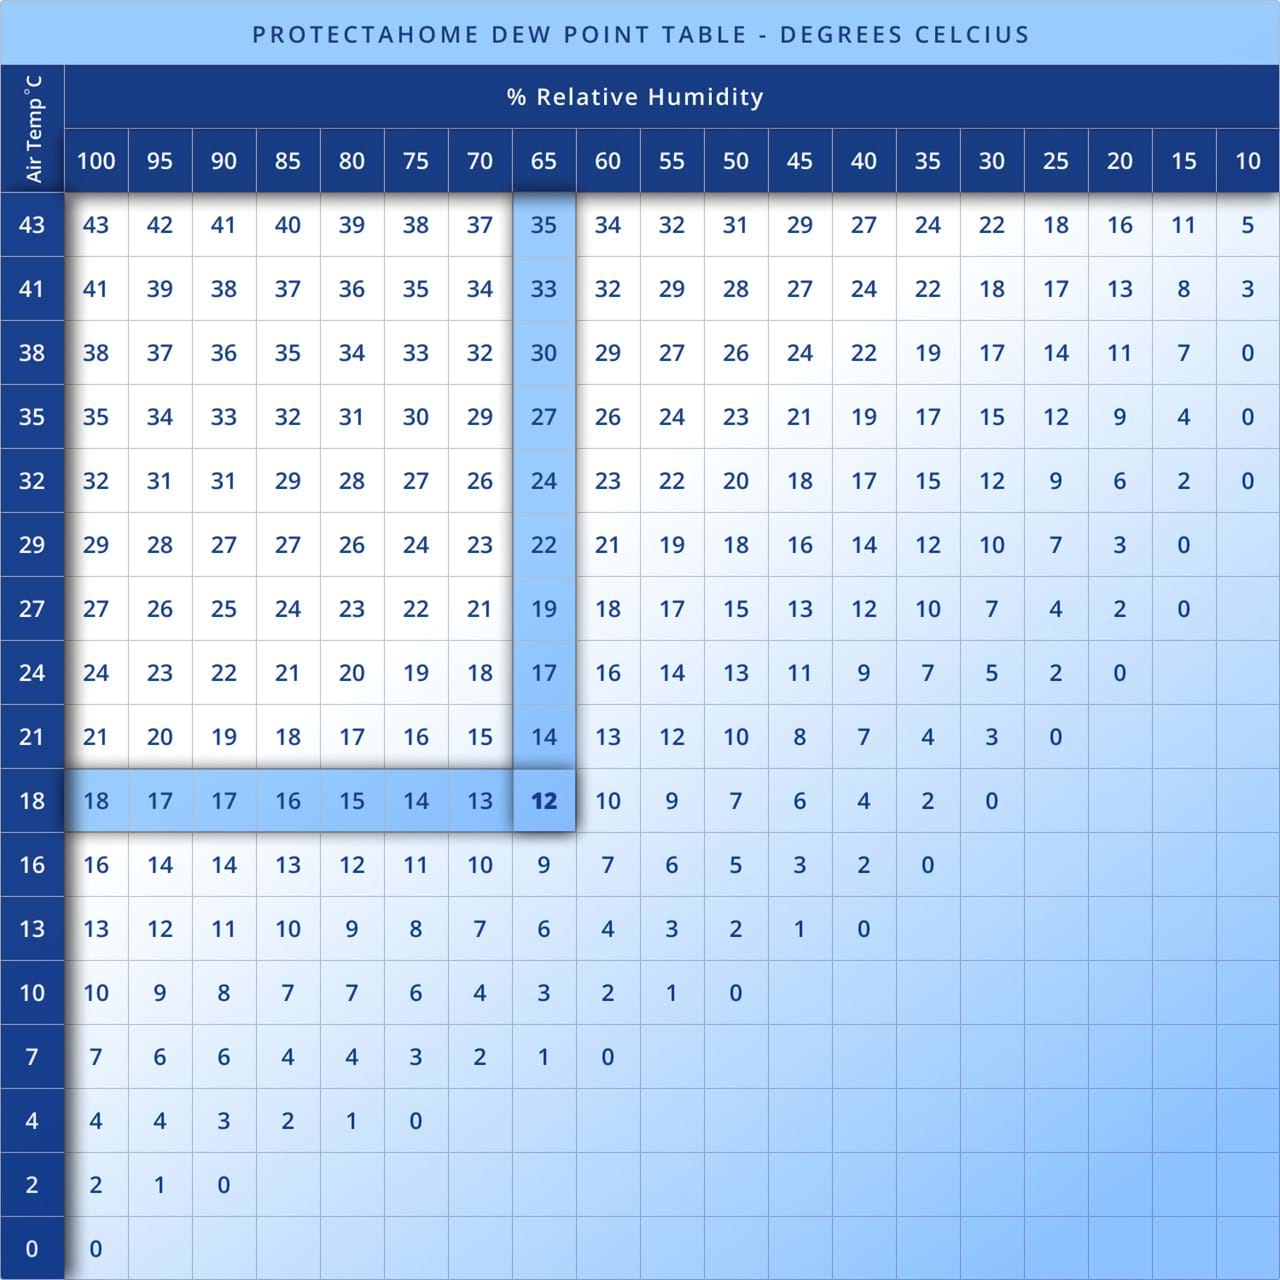
The dew point chart is a valuable tool for meteorologists, engineers, and anyone interested in understanding atmospheric moisture. By learning to interpret it, you can better predict weather conditions, ensure efficient HVAC operations, and maintain comfort in indoor environments. This article will delve into the concept of dew point, its importance, and how to read and utilize a dew point chart effectively.
What is Dew Point?
The dew point is the temperature at which air becomes saturated with moisture, leading to condensation. When the air temperature drops to the dew point, water vapor condenses into liquid water, forming dew. This concept is vital in understanding humidity, weather patterns, and atmospheric processes.
Why is Dew Point Important?
The dew point provides critical insights into atmospheric moisture content and its potential effects. Here are some key reasons why the dew point is significant:
Weather Prediction: A higher dew point often indicates humid conditions and a likelihood of precipitation, fog, or thunderstorms.
Human Comfort: The dew point affects how comfortable we feel. A dew point above 60°F (16°C) usually feels muggy, while lower dew points result in drier, more comfortable air.
Industrial Applications: Industries like agriculture, HVAC, and manufacturing rely on dew point readings to maintain optimal conditions for equipment and processes.
Aviation Safety: Pilots use dew point data to assess visibility and icing conditions during flights.
Understanding a Dew Point Chart
A dew point chart visually represents the relationship between air temperature, humidity, and dew point. It simplifies the process of determining dew point by correlating relative humidity (RH) and temperature. Here’s how to interpret it:
Horizontal Axis: Typically represents the air temperature in degrees Fahrenheit (°F) or Celsius (°C).
Vertical Axis: Represents the dew point temperature.
Curves or Lines: The chart includes curves or lines that represent different levels of relative humidity (e.g., 10%, 50%, 90%).
To use a dew point chart, locate the air temperature on the horizontal axis and the relative humidity on the curve. The intersection of these values indicates the dew point temperature.
How to Use a Dew Point Chart
Using a dew point chart is straightforward once you understand the parameters:
Measure Air Temperature: Use a thermometer to determine the current air temperature.
Determine Relative Humidity: Obtain the RH value from a hygrometer or weather station.
Find the Intersection: Locate where the air temperature and relative humidity intersect on the chart to find the dew point.
Practical Applications of Dew Point Charts
Weather Forecasting
Meteorologists use dew point charts to predict weather conditions. For example, when the dew point is close to the air temperature, fog or precipitation is likely.
HVAC Systems
In heating, ventilation, and air conditioning, maintaining the right dew point is crucial for energy efficiency and comfort. HVAC engineers use dew point charts to design systems that regulate indoor air quality effectively.
Industrial Processes
Processes like painting, coating, and food storage rely on controlled humidity levels. A dew point chart helps maintain conditions that prevent condensation or spoilage.
Agriculture
Farmers use dew point data to predict dew formation, which can impact crop conditions. High dew points may signal the risk of plant diseases caused by excessive moisture.
Dew Point vs. Relative Humidity
While dew point and relative humidity are related, they are distinct concepts:
- Dew Point: A fixed temperature indicating saturation.
- Relative Humidity: A percentage showing how close the air is to saturation at a given temperature.
For instance, an RH of 50% at 80°F may have the same dew point as an RH of 100% at 60°F. The dew point is a more stable measure of moisture content.
Factors Affecting Dew Point
Several factors influence dew point readings, including:
Temperature: Higher temperatures can hold more moisture, affecting the dew point.
Altitude: Dew point decreases with altitude due to lower air pressure and temperature.
Seasonal Changes: Dew points vary with seasonal humidity levels, especially in regions with significant climatic shifts.
Tips for Maintaining Comfort Based on Dew Point
Understanding dew point can help you adjust your environment for comfort:
Monitor Indoor Humidity: Keep indoor RH between 30% and 50% to maintain a comfortable dew point.
Use Dehumidifiers: In humid conditions, dehumidifiers can lower the dew point, improving comfort.
Ventilate Properly: Ensure adequate ventilation to prevent excessive moisture buildup.
Limitations of Dew Point Charts
While dew point charts are useful, they have limitations:
Static Conditions: They assume steady temperature and RH, which can fluctuate in dynamic environments.
Interpretation Errors: Misreading the chart or using inaccurate measurements can lead to incorrect conclusions.
Not Location-Specific: Dew point charts provide general guidance and may not account for localized factors like microclimates.
Conclusion
The dew point chart is a versatile and essential tool for anyone dealing with atmospheric moisture, whether for weather forecasting, HVAC optimization, or industrial processes. By understanding the dew point and learning to use the chart effectively, you can make informed decisions to enhance comfort, safety, and operational efficiency. Whether you’re a professional or a weather enthusiast, mastering the dew point chart empowers you to interpret and manage moisture-related challenges with confidence.


Leave a Reply