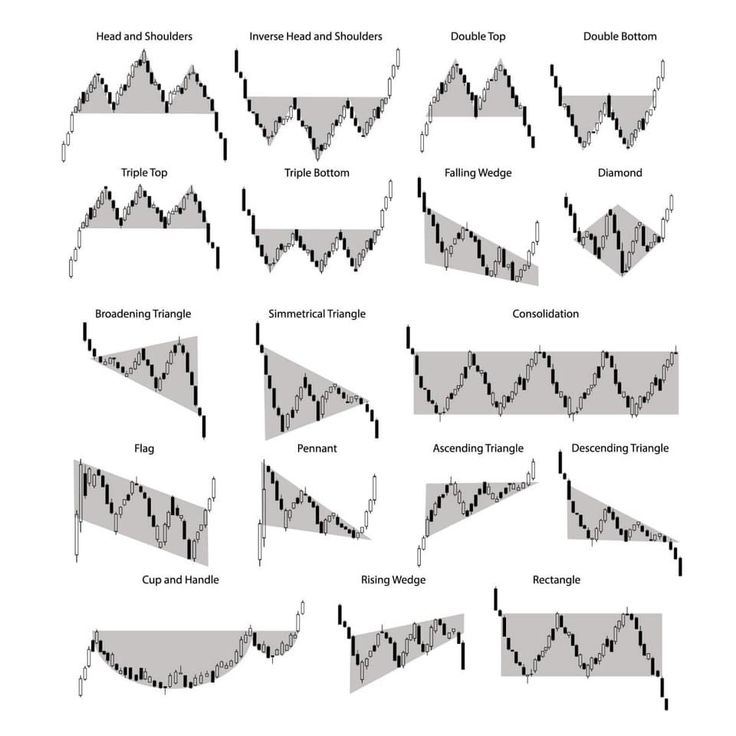
Chart patterns are essential tools for traders and investors in the financial markets. By identifying recurring price movements on charts, traders can make informed decisions about when to buy, sell, or hold assets. This guide explores the most common chart patterns, their significance, and how to use them effectively in your trading strategy.
What Are Chart Patterns?
Chart patterns visually represent historical price movements, offering clues about future market behavior. They form the foundation of technical analysis, helping traders predict potential market directions based on price action. Patterns typically indicate either a continuation or a reversal of a trend.
There are two main types of chart patterns:
- Continuation Patterns: Suggest that the current trend will likely continue.
- Reversal Patterns: Indicate a potential change in the current trend direction.
Importance of Chart Patterns in Trading
Understanding chart patterns enables traders to:
Identify Market Trends: Chart patterns highlight bullish, bearish, or neutral trends.
Optimize Entry and Exit Points: Patterns guide traders on when to enter or exit trades.
Manage Risk: By recognizing key levels of support and resistance, traders can set stop-loss and take-profit orders effectively.
Key Chart Patterns Every Trader Should Know
Let’s dive into some of the most widely recognized chart patterns, grouped into continuation and reversal patterns.
Continuation Patterns
Triangles
- Ascending Triangle: Characterized by a horizontal resistance line and an upward-sloping support line. It’s a bullish pattern, often indicating a breakout to the upside.
- Descending Triangle: Features a horizontal support line and a downward-sloping resistance line. It’s a bearish pattern, signaling a potential downside breakout.
- Symmetrical Triangle: Composed of converging trendlines with no clear bias. The breakout direction often depends on the preceding trend.
Flags and Pennants
- Flag: Appears as a rectangular consolidation phase following a sharp price movement (flagpole). It can be bullish or bearish, depending on the direction of the flagpole.
- Pennant: Similar to a flag but with converging trendlines, resembling a small symmetrical triangle. It signifies a continuation of the preceding trend.
Cup and Handle
- Resembles a teacup with a rounded bottom (the cup) followed by a small consolidation phase (the handle). This bullish pattern suggests an upward breakout.
Reversal Patterns
Head and Shoulders
- Head and Shoulders Top: Consists of three peaks, with the middle peak (head) higher than the others (shoulders). It signals a bearish reversal.
- Inverse Head and Shoulders: The inverse formation indicates a bullish reversal, often appearing at the bottom of a downtrend.
Double Top and Double Bottom
- Double Top: Features two peaks at a similar level, suggesting a bearish reversal.
- Double Bottom: Composed of two troughs at a similar level, indicating a bullish reversal.
Triple Top and Triple Bottom
- Triple Top: Forms three peaks at a similar level, signaling strong resistance and a bearish reversal.
- Triple Bottom: Features three troughs at a similar level, suggesting robust support and a bullish reversal.
How to Use Chart Patterns in Trading
Recognizing the Pattern
- Study historical price movements and identify recurring shapes or formations.
- Confirm the pattern using volume trends; for instance, breakouts are often accompanied by increased volume.
Establishing Entry Points
- For continuation patterns, enter trades once the price breaks out in the direction of the trend.
- For reversal patterns, wait for confirmation of a trend change before entering.
Setting Stop-Loss and Take-Profit Levels
- Place stop-loss orders slightly beyond key support or resistance levels.
- Set take-profit levels based on the height of the pattern—for example, the height of a triangle can help estimate the breakout’s potential range.
Common Mistakes to Avoid
Ignoring Volume: Breakouts with low volume may be false signals.
Overtrading: Not all patterns result in successful trades. Avoid forcing trades based on incomplete or unclear patterns.
Lack of Confirmation: Always wait for a confirmed breakout or trend change before committing capital.
Advanced Tips for Mastering Chart Patterns
Combine with Indicators: Use indicators like moving averages, RSI, or MACD to confirm signals from chart patterns.
Understand Market Context: Assess broader market conditions, such as economic events or news, that may influence price movements.
Practice Patience: Successful trading requires discipline. Wait for patterns to fully form and confirm before taking action.
Conclusion
Mastering chart patterns is a valuable skill that can significantly enhance your trading strategy. By understanding the nuances of different patterns and combining them with other analytical tools, traders can gain a competitive edge in the markets. Always remember to manage risk effectively and continuously refine your skills through practice and education.


Leave a Reply